

 The Marlowsphere Blog (#84)
A recent online Huffington Post article “SAT Results for 2013 Show Low Rates of College Preparedness” reported the apparent sorry state of college preparedness on the part of senior high school students. According to the College Board: Only 43 percent of test-takers in 2013 met the SAT’s definition of being prepared for college, a statistic that has remained stagnant since 2009. Further, “The 1.6 million test-takers averaged 496 in reading, 514 on math and 488 on writing, according to a recent report released by the College Board, the company behind the notorious college entrance exams.”
According to the article, the College Board defines the college-ready benchmark as 1550 out of 2400, a score the organization says indicates a 65 percent likelihood of a student earning a first-year college GPA of a B-minus or above.
Since 1972, the first year from which the College Board lists comparable SAT results, scores have continuously declined. In 1972, students averaged a 530 in reading and a 509 in math; in 1995, they scored an average 504 in reading and a 506 in math; in 2003, they scored 507 in reading and 519 in math, compared to 496 on reading and 514 on math this year [2013]. In 2006, the first year the writing portion of the test was offered, students averaged 497, compared to 488 this year.
Undoubtedly, these consistently declining scores will generate additional debates—debates (and hand-wringing) that have been going on among educators, K-12 administrators, politicians, and parents for several decades. The debates (and hand-wringing), notwithstanding, the fact remains SAT scores have consistently declined since the early 1970s in the United States.
But wait. There’s more. There’s also trouble with respect to adult American’s practical workplace skills. According to an online Huffington Post article posted on October 8, 2013, “OECD Skills Test: U.S. Adults Lag In Practical Workplace Skills”:
 Americans performed below the international average on math, reading and problem-solving on the exam, known as the Program for the International Assessment of Adult Competencies. U.S. math skills lagged far behind top performers, including Japan and Finland. The Organisation for Economic Co-operation and Development, based in Paris, released the results. . . .
“These findings should concern us all. They show our education system hasn’t done enough to help Americans compete — or position our country to lead — in a global economy that demands increasingly higher skills,” U.S. Secretary of Education Arne Duncan said in a statement. “While the PIAAC study places our highest-skilled adults on par with those in other leading nations, the findings shine a spotlight on a segment of our population that has been overlooked and underserved: the large number of adults with very low basic skills, most of whom are working.”
The test is designed to gauge literacy and other skills necessary in the global economy. Statisticians have called it the richest international comparison in cognitive skills and human capital. PIAAC comes from the Organisation for Economic Co-operation and Development’s Andreas Schleicher. Schleichler created the Program for International Student Assessment, one of the most influential tests of 15-year-old students across the globe.
There is, perhaps, a larger economic and demographic context to the symptoms described above. In almost this same time period – i.e., from the early 1970s until now – economic and technological developments have occurred—that can be perceived as either connected or inconveniently coincidental—that may be contributory to the steady decline in SAT scores.
First, it is a fact that between 1980 and now the number of companies that own 90% of media assets in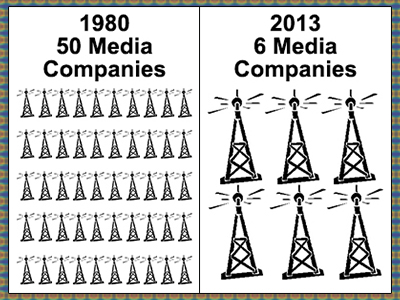 the United States has shrunk dramatically— from 50 in 1980 to six today! This means – to state the obvious – these six companies are in a position to dictate the content and distribution of print and electronic media on a very large scale. Their central motivation? Control of the media marketplace in the service of minimizing risk and maximizing profits (see my Blog #13).
In the same time period the number of individuals attaining top 1-2% economic status has also shrunk dramatically while owning a greater disproportion of financial assets than ever before, to the buying power detriment of the so-called American middle class and the economic pulverizing of the lower classes.
For example, it was recently reported that approximately 15% of the people in this country—the so-called most powerful nation on earth—exist below the defined poverty line. According to a September 2011 New York Times article “. . . 2.6 million people slipped into poverty in the United States last year, the Census Bureau reported. . . , and the number of Americans living below the official poverty line, 46.2 million people, was the highest number in the 52 years the bureau has been publishing figures on it.” Further, “Economists pointed to a telling statistic: It was the first time since the Great Depression that median household income, adjusted for inflation, had not risen over such a long period, said Lawrence Katz, an economics professor at Harvard.” The report said the percentage of Americans living below the poverty line the previous year [2010],15.1 percent, was the highest level since 1993. (The poverty line in 2010 for a family of four was $22,314.) .
According to the Census Bureau, in 2012, the official poverty rate was 15.0 percent—that’s 46.5 million people in poverty in the United States. This data is from the Current Population Survey (CPS), 2013 Annual Social and Economic Supplement (ASEC), the source of official poverty estimates. The CPS ASEC is a sample survey of approximately 100,000 households nationwide.
Former United States President Jimmy Carter echoes this “poverty” scenario with his longer-term perspective. In an online AP article published on October 8, 2013 “. . .Carter says the income gap in the United States has increased to the point where members of the middle class resemble the Americans who lived in poverty when he occupied the White House.”
Further,
During an exclusive interview with The Associated Press, he said that years of tax breaks for the wealthy, a minimum wage untethered from the inflation rate and electoral districts drawn to maximize political polarization have reduced the quality of life for all but the richest Americans.
 Here’s another inconvenient economic fact: at the time of the beginning of the Reagan administration in the early 1980s, the United States was the world’s creditor nation. Today, the United States is one of the world’s biggest debtor nations. Is it merely coincidence that during this 30+ year period most of the presidents were Republicans who in one exhale breath promoted conservative fiscal and monetary policies, while in the next inhale breath spent exorbitantly on military incursions and weaponry, such as during the Iraqi and Afghanistan wars?
In March 2010, James Turk in The Free Gold Report described the shift as follows:
Only a few decades ago, . . . American capital spanned the globe financing all types of investments in virtually every country. But that dominance began to erode in the 1960s because growth in consumption in the United States was starting to outpace new production. Wealth built up over generations was being consumed.
To compensate for the resulting decline in living standards, the nation turned to debt, rather than hard work and savings. This trend continued through the next decade. A focus on consumption and a seemingly unstoppable reliance on debt at all levels of American society had become the dominant force in economic activity.
. . . .
The mindset of policymakers today continues to be one of debt and consumption instead of savings, investment and production. We see this way of thinking in their pronouncements and actions. Worryingly, the tipping point appears to have been reached. Not only is the United States living beyond its means, it is now borrowing beyond its means. . . .
Other possible demographic shifts having an adverse impact on declining SAT scores and declining competitive workplace skills over time is the increase in single family homes and working mothers.
Vanessa Bianchi—an Occupational Therapist with 10+ years of experience working in the upper-level K-12 public school system in Queens, New York—has increasingly observed: “. . .a decline in student academic acumen when the student comes from a family where the mother is either a single mother or is a working mother in a two-parent home.”
This is not just a local happening. According to an online article by Kirsten Anderson from LifeSiteNews.com published January 4 of this year, the headline reads:
The article goes on to say:
The Washington Times analyzed the most recent census data [2010], showing that the percentage of two-parent families has dropped significantly over the past decade in all 50 states. Even as the total number of American households with children increased by 160,000, the number of two-parent households decreased by 1.2 million.
Today, one-third of American children – a total of 15 million – are being raised without a father. Nearly five million more children live without a mother.
The implicit importance of the “stay-at-home-mother-as-teacher-cum-breadwinner” is further underscored by an article by Catherine Rampell entitled “U.S. Women on the Rise as Family Breadwinner,” published: May 29, 2013.
 The article reads in part:
Women are not only more likely to be the primary caregivers in a family. Increasingly, they are primary breadwinners, too.
Four in 10 American households with children under age 18 now include a mother who is either the sole or primary earner for her family, according to a Pew Research Center analysis of Census and polling data released Wednesday. This share, the highest on record, has quadrupled since 1960.
There’s a lot more to the story. Next week’s blog will attempt to take a larger technological perspective on the symptoms articulated above.
Please write to me at meiienterprises@aol.com if you have any comments on this or any other of my blogs.
Eugene Marlow, Ph.D.
November 4, 2013
© Eugene Marlow 2013